โ–ถ๏ธ Video Tutorials

Lee Group at CU Denver YouTube tutorials, organized by topic

๐Ÿ“บ Lee Group YouTube Channel

All POKY tutorials are produced by the Lee Research Group at CU Denver and collected in the official POKY tutorial playlist. The categories below group the playlist by workflow stage โ€” open the channel directly if a specific video isn't embedded here yet.

๐Ÿ“‹ Categories

Getting Started

Installation, the POKY main window, and the SIM-PRAC practice dataset.

Installing POKY on Mac thumbnail►
Installing POKY on Mac
Platform setup and first launch of the POKY main window
Installing POKY on Windows 10 thumbnail►
Installing POKY on Windows 10
Platform setup and first launch of the POKY main window
Installing POKY on Linux thumbnail►
Installing POKY on Linux (Ubuntu 20.04)
Platform setup and first launch of the POKY main window
SIM-PRAC Practice Dataset thumbnail►
SIM-PRAC Practice Dataset
Generate a simulated protein dataset to follow along with tutorials

Data Processing

Processing raw NMR data with POKY Phaser.
Process 2D NMR with POKY Phaser thumbnail►
Process 2D NMR with POKY Phaser
Processing raw 2D NMR data directly inside POKY

Data Import

Bruker import, NMRPipe import, and spectral alignment.
Importing Bruker & NMRPipe Data thumbnail►
Importing Bruker & NMRPipe Data
Drag-and-drop and command-line conversion to UCSF format โ€” see File Formats
Spectral Alignment thumbnail►
Spectral Alignment
Aligning ppm references across multiple spectra

Peak Picking

Restricted peak picking and APES automated backbone peak picking.
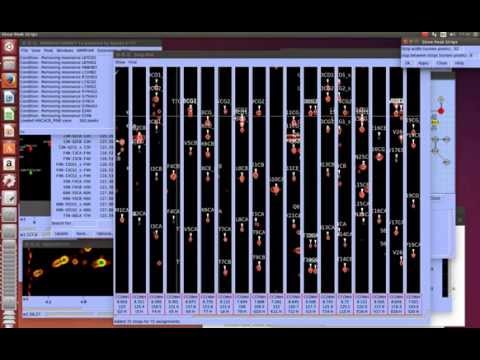
Automated Peak Picking and Validation Strategy thumbnail►
Automated Peak Picking and Validation Strategy
APES backbone peak picking workflow โ€” see Picking Peaks
Region and Restricted Peak Picking Strategy thumbnail►
Region and Restricted Peak Picking Strategy
Region and restricted peak picking workflow

Backbone Assignment

Project preparation and manual backbone assignment.
Manual Backbone Assignment thumbnail►
Manual Backbone Assignment
Step-by-step backbone assignment โ€” see Making Assignments

Strip Plots

Setting up and navigating strip plots for sequential assignment.
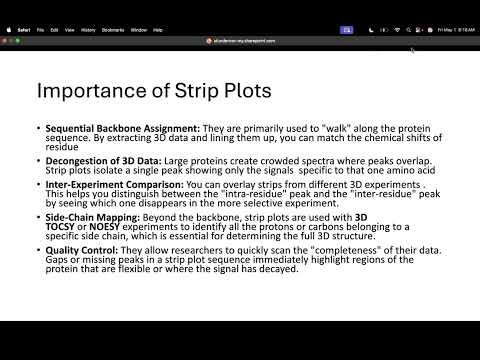
Strip Plot Walkthrough thumbnail►
Strip Plot Walkthrough
See Command Reference for all strip commands

Sidechain Assignment

Manual sidechain assignment and the Predict-and-Confirm method.
Manual Sidechain Assignment by Zowie Werner thumbnail►
Manual Sidechain Assignment
Manual protein NMR sidechain assignment by Zowie Werner
Predict-and-Confirm Sidechain Assignment thumbnail►
Predict-and-Confirm Sidechain Assignment
Superfast sidechain assignment referencing PACSY โ€” see Command Reference

Automated Assignment (I-PINE)

Automated backbone/sidechain assignment with I-PINE and PINE-SPARKY.2.
Automated Assignment with PINE / PINE-SPARKY thumbnail►
Automated Assignment with I-PINE / PINE-SPARKY
See Automatic Assignment for the full I-PINE/PINE-SPARKY.2 workflow

Full playlist: Automated Assignment โ€” Lee Group YouTube

Chemical Shift Analysis

Secondary chemical shifts, LACS validation, and BMRB reference views.
LACS Chemical Shift Validation thumbnail►
LACS Chemical Shift Validation
Outlier detection and referencing correction โ€” see Command Reference
Secondary Chemical Shift Analysis thumbnail►
Secondary Chemical Shift Analysis
Comparing shifts to PACSY coil statistics

TALOS+: Secondary Structure & Dihedral Angles

Predict secondary structure, dihedral angles, and backbone flexibility from chemical shifts.
Secondary Structure Dihedral Angles and Flexibility Prediction by TALOS+ thumbnail►
Secondary Structure, Dihedral Angles & Flexibility by TALOS+
Prediction from chemical shifts using TALOS+ inside POKY

Structure Calculation

POKY Structure Builder and 3D structure calculation with PONDEROSA.
POKY Structure Builder (Pb) thumbnail►
POKY Structure Builder (Pb)
One-click 3D structure calculation setup โ€” see Command Reference
3D Structure Calculation of a Protein thumbnail►
3D Structure Calculation of a Protein
Full structure calculation walkthrough by Karen Pham

AI Structure Prediction

Deep-learning structure prediction for proteins and biomolecular complexes inside POKY.

Biomolecular Complex Structure by Boltz-1 and Chai-1 thumbnail►
Boltz-1 & Chai-1: Biomolecular Complex Structure
Predicting 3D biomolecular complex structures using Boltz-1 and Chai-1 (AlphaFold 3 analogs) in POKY
ESMFold Protein Structure Prediction with POKY thumbnail►
ESMFold Protein Structure Prediction
ESMFold-based protein structure prediction integrated in POKY

Dynamics

T1/T2/hetNOE relaxation analysis using POKY Notepad, rh and np plugins.
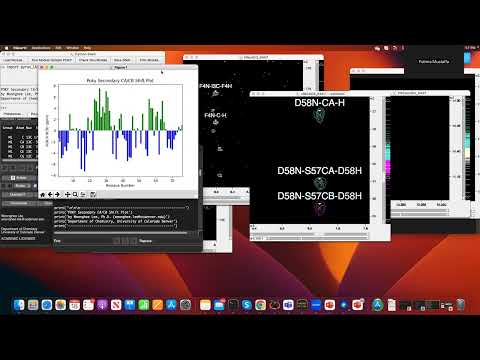
T1/T2/hetNOE Relaxation Analysis thumbnail►
T1/T2/hetNOE Relaxation Analysis
Using POKY Notepad and the rh / np commands
T1/T2/hetNOE using rh and np plugins thumbnail►
T1/T2/hetNOE using rh & np Plugins
Relaxation analysis via the rh and np plugins
T1/T2/hetNOE using POKY Notepad thumbnail►
T1/T2/hetNOE using POKY Notepad
Relaxation analysis workflow using POKY Notepad (Abigail Chiu)

NMR Perturbation & CSP

Chemical shift perturbation analysis and titration plots for studying protein-ligand interactions.
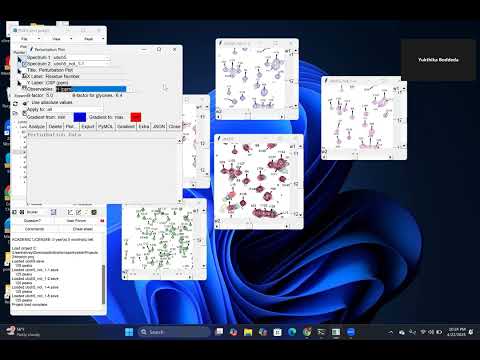
NMR Perturbation and Titration Plots thumbnail►
NMR Perturbation & Titration Plots
Chemical shift perturbation analysis by Yukthika Boddeda

CHESCA/CHESPA-SPARKY

Automated NMR data analysis for protein allostery mapping โ€” see the CHESCA/CHESPA-SPARKY site for full documentation and example datasets.
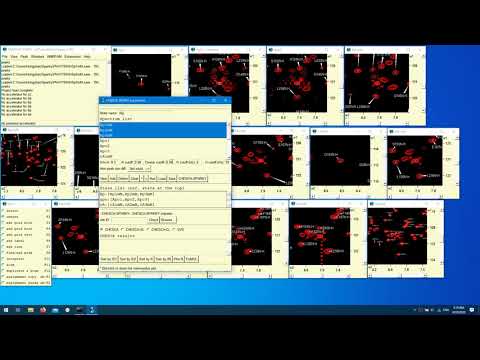
CHESCA-SPARKY setup thumbnail►
CHESCA-SPARKY: Setup
Setting up CHESCA-SPARKY for covariance-based allosteric network analysis
CHESCA analysis for allosteric network mapping thumbnail►
CHESCA-SPARKY: Allosteric Network Mapping
Interpreting CHESCA-SPARKY results for allosteric network analysis
CHESPA-SPARKY setup for spectral projection analysis thumbnail►
CHESPA-SPARKY: Spectral Projection Analysis
Setting up CHESPA-SPARKY for allosteric mapping via chemical shift projection analysis

REDEN Peak Decomposition

Interactive multi-fitting decomposition for crowded NMR spectral regions.
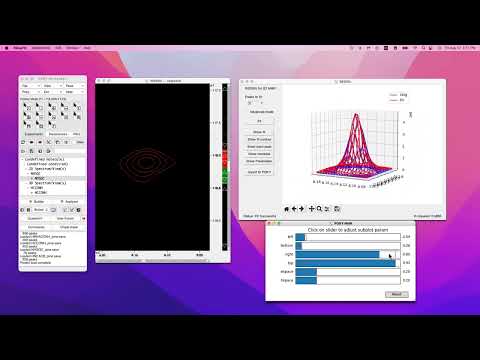
REDEN Basic 2D Peak Decomposition thumbnail►
REDEN Basic 2D Peak Decomposition
Basic workflow for interactive peak decomposition with REDEN
REDEN Peak Decomposition thumbnail►
REDEN Peak Decomposition II
Advanced multi-fitting peak decomposition with REDEN

Metabolomics (A-SIMA & A-MAP)

NMR-based metabolite identification with A-SIMA and multivariate statistical analysis with A-MAP.


A-SIMA on 1D NMR thumbnail►
A-SIMA on 1D NMR
Metabolite identification on 1D NMR data using A-SIMA
A-SIMA on 2D NMR thumbnail►
A-SIMA on 2D NMR
Metabolite identification on 2D NMR data using A-SIMA
A-MAP on 1D NMR thumbnail►
A-MAP on 1D NMR
Multivariate statistical analysis (PCA, OPLS-DA) on 1D NMR metabolomics data
A-MAP on 2D NMR thumbnail►
A-MAP on 2D NMR
Multivariate statistical analysis (PCA, OPLS-DA) on 2D NMR metabolomics data

Utilities

Command finder, label display, and the overlay dialog.
Command Finder & Easy Overlay Dialog thumbnail►
Command Finder & Easy Overlay Dialog
Quickly locate any two-letter command, and the eo overlay dialog